FPV Math: Precision Mass for 21st-Century Warfare
Part 2 of a Series on FPV Drone Warfare and Loitering Munitions
First-person view (FPV) attack drones and loitering munitions are changing the character of war. As part of a larger trend of robotics, artificial intelligence, and automation, FPV drones enable massed, precision strikes at accessible cost and technological entry points. In this new tactical paradigm, foot-mobile light infantry armed with FPV drones can now hold heavily armored and mechanized formations at risk with unprecedented ease.
This article explores the kill chain math of this new technology. By many accounts, FPV drones proved very effective in the recent Syrian rebel campaign, where rebel forces caught Syrian government forces largely unprepared for any offensive, much less one involving massed FPV drone strikes. However, FPV drone operations recently observed in Syria differ from the situation in Ukraine, where years of FPV drone employment and innovation by both sides have led to the development of countermeasures and a probing, high-attrition dynamic. Below, a basic statistical model is proposed to understand the tactical factors of effective FPV employment. This model is then scaled to show outcomes at a campaign level. Using our model to compare the Syrian and Ukrainian cases demonstrates the varying effectiveness of FPV drones under different circumstances. Understanding these implications is instructive for tactical employment and how investments in other areas can impact FPV effectiveness for attackers and defenders.
Kill Chain Modeling
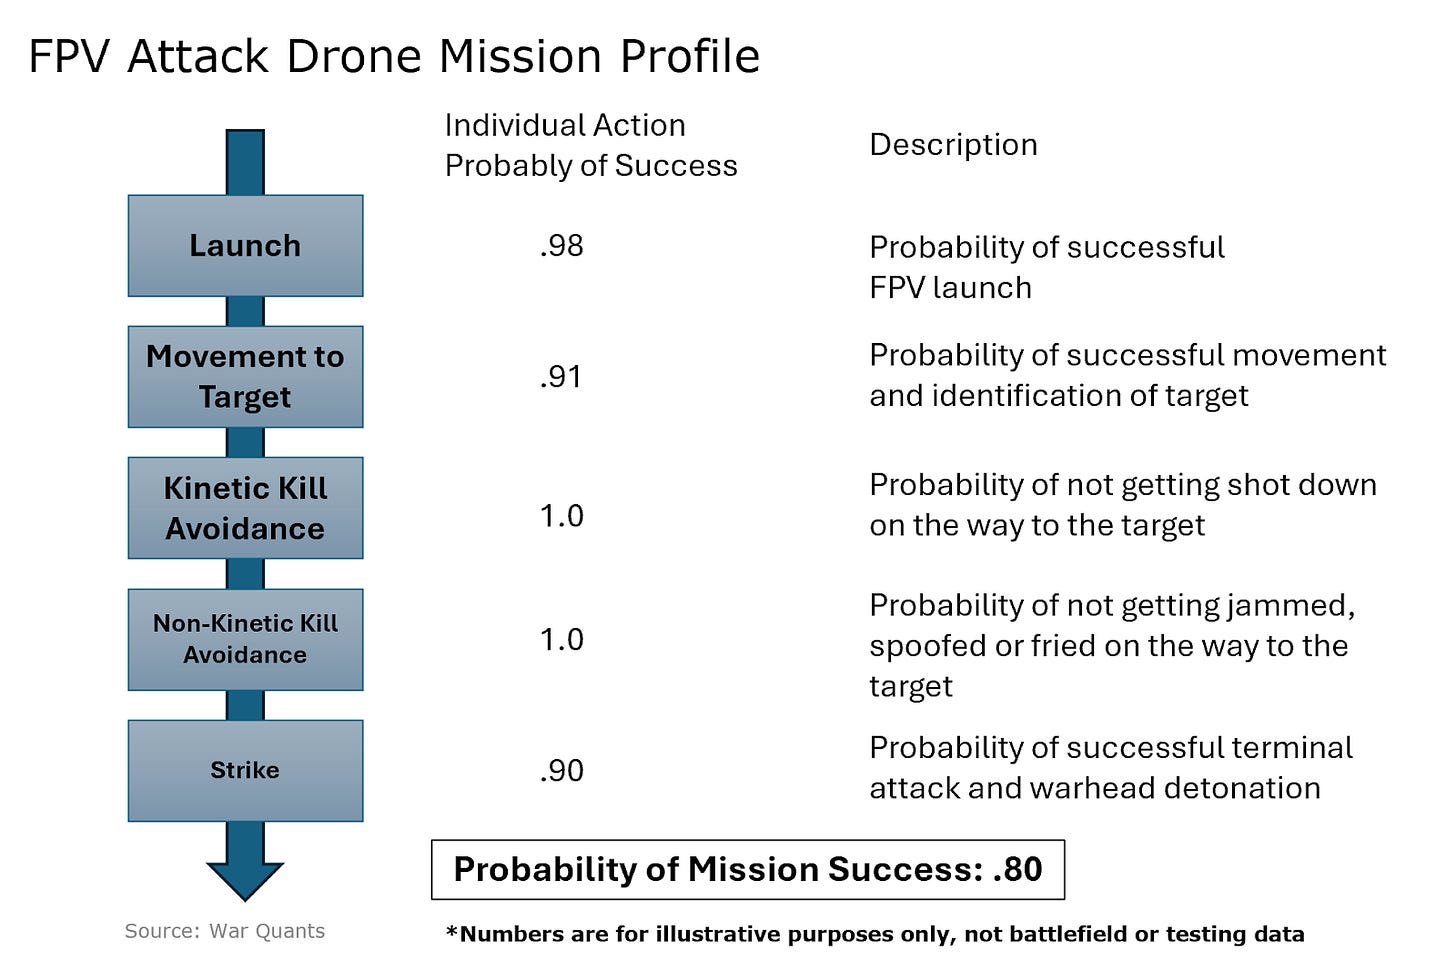
To model FPV strikes, the first step is to break down a mission into its constituent pieces and assign success probabilities at each stage. The model outlines five distinct phases of an FPV attack mission: launch, movement to target, kinetic kill avoidance, non-kinetic kill avoidance, and strike.
This model involves a key assumption: each stage's success is independent of every other stage of the mission. For example, successful warhead detonation is not conditioned on a successful launch. Also, note that while the model is shown in a linear sequence, not all steps must be in this exact order. Specifically, kinetic and non-kinetic kill avoidance are continuous from launch to strike.
The launch phase involves successfully arming the FPV and getting it into the air. For an improvised FPV, the munition may explode during arming or takeoff, or a motor may fail.
Movement to the target includes the FPV transiting to the employment area. If the FPV gets lost, the ordnance prematurely detonates, or the link between the controller and drone is lost, the flight fails.
Both kinetic and non-kinetic kill avoidance capture the risk of drone countermeasures. Whether jammed or shot down, drones can be intercepted on their way to the target.
Finally, the strike step incorporates an FPV terminal attack and successful warhead detonation. A non-automated terminal attack by a human operator can miss a target and strike the ground or a structure beside it. Even if the FPV successfully hits the target, the warhead may not detonate due to a fuze failure.
With the model phases identified, the next step is to assign probabilities of successful completion of all steps. The success probabilities of each step depicted here are for illustrative purposes. Testing, evaluation, and battlefield data would be needed for more precision and accuracy. However, the probabilities chosen here are meant to illustrate the conditions of FPV employment in the recent Syrian rebel campaign. Note that the likelihood of kinetic and non-kinetic kill avoidance are both 100% to represent the apparent lack of defensive drone countermeasures in Syrian army formations.
In this specific model, the probability of mission success for a single FPV attack drone against a single target is 80%. Imagine this individual FPV attack as a biased coin flip, where heads equals success. In this case, the coin lands on heads (a successful attack) 80% of the time.
Campaign and Battle Modeling
Individual kill chain successes can scale and allow commanders to examine more extensive engagements with hundreds or thousands of FPV drones. This model is based on broad assumptions, and while higher-fidelity models can be used to capture more detailed considerations, this model can provide a base understanding of FPV drone use at the campaign level.
Imagine a campaign or battle where the attacker uses 1000 FPV attack drones. Each attack has the characteristics of the above model with an 80% success rate. If you flip a coin 1000 times with an 80% probability of heads (a successful attack), you simulate a campaign involving one thousand individual FPV attacks. Across many such campaigns, the attacker would average 800 successful attacks; however, due to variability, there are many other potential outcomes in a single campaign. Indeed, in simulation, total successes varied from as many as 820 successes to as few as 760. The result is a distribution that can help leaders plan a best-case, worst-case, and average scenario.
In this case, the outcome of the simulation is below.
In the best-case scenarios, there are over 820 successful FPV strikes. In the worst-case scenarios, there are less than 780. On average, as expected, there are approximately 800 successful strikes. From these numbers, planners can derive magazine depth and ordnance requirements. If planners want to ensure a minimum number of successes with high confidence, they should assume a higher margin of error and build in conservative assumptions. For example, a conservative planner might reasonably estimate 780 successful strikes for 1000 FPV attack drone sorties from this experiment.
Counter Measures
The case above is loosely based on the Syrian rebel campaign, where, as noted, the Syrian Army did not employ effective drone countermeasures. This scenario is similar to earlier stages of the Ukrainian conflict. However, as the war in Ukraine has progressed, FPV drone countermeasures have been developed, and the overall effectiveness of FPV attacks has decreased. In the model below, parameters are adjusted to account for these countermeasures. For example, imagine that the adversary force possesses tactical jamming capabilities that cause attacks to fail. The model below therefore decreases the probability of non-kinetic kill avoidance to 50%.
This reduction in success of non-kinetic kill avoidance decreases the probability of individual mission success to 40%, and also significantly decreases the expected total number of successes in a campaign.
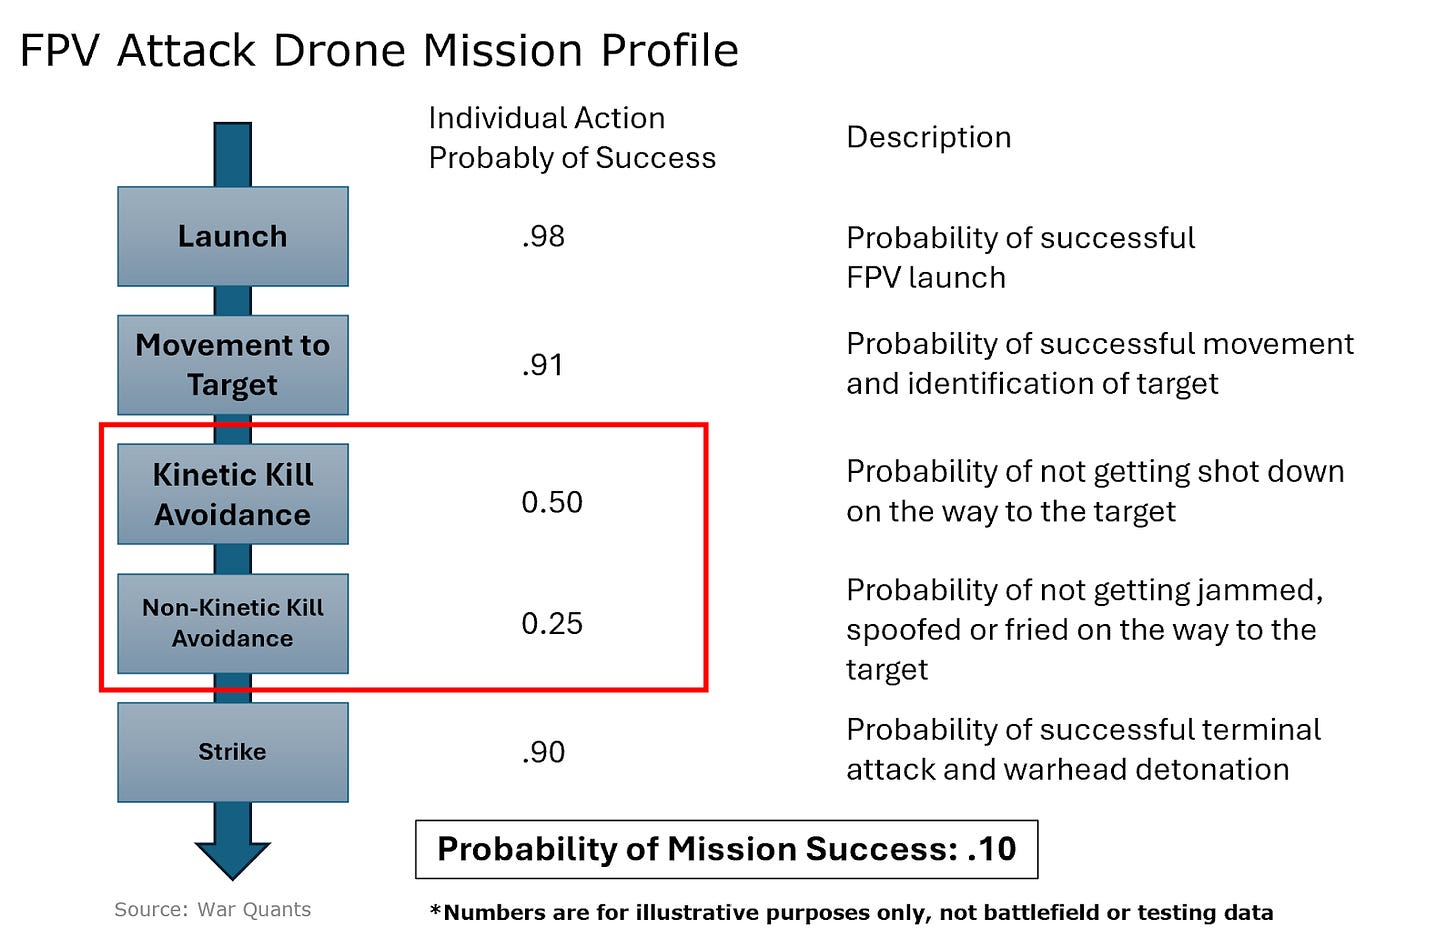
The overall success rate may decline even more if the adversary possesses kinetic and non-kinetic counter-UAS capabilities. The following example shows a case where there is a high probability that the FPV attack drone will be shot down or jammed. Overall mission success rates plummet to 10%.
The next chart shows the outcomes after running 1000 FPV attack scenarios for each of the three sets of success probabilities. The first scenario is the green distribution, with an 80% probability of individual attack success. The second scenario is the yellow distribution, with a 40% probability of individual attack success. Finally, the third scenario is the red distribution, with a 10% probability of individual attack success. An attacker would desire an outcome like scenario one, which represents an almost unimpeded ability to attack with FPVs against an opponent with no countermeasures. Defenders would desire an outcome like scenario three, which suggests the effective employment of robust anti-drone capabilities.
Applying the Model to the Syrian Rebel Offensive
Syrian rebels recently achieved a smashing victory against the Syrian army, with FPVs providing powerful precision fire capabilities. The Syrian Army appeared to have no kinetic or non-kinetic counter-UAS capabilities; therefore, the likelihood of individual strike success was extremely high. Meanwhile, electronic warfare has taken center stage in Ukraine, with significant jamming and other capabilities on both sides. Additionally, kinetic capabilities such as anti-air machine guns or interceptor drones can destroy FPVs before they reach their target. Defenders using both kinetic and non-kinetic countermeasures could potentially drive down the overall FPV drone attack success rate from 80% to closer to 10-20%, as shown in the three scenarios above.
The Syrian government appeared to have no such defensive capabilities. It remains unclear how many FPV drones the rebels effectively employed in their offensive, but using the worst-case, base-case, and best-case numbers from the campaigns involving an 80% probability of attack success,the model suggests that the rebels could have achieved 780-820 successful strikes for every 1000 FPV drones employed. Depending on how many FPVs were required per target, that number of successful strikes could equate to the Syrian army losing hundreds of vehicles, personnel, and equipment sets. After over a decade of war, such losses would be devastating. As a base reference, if it cost the rebels $2000 per FPV drone and they used 1000 drones, they could have completely changed the direction of the war for a price of $2 million (or 20 bitcoin at the time of writing).
Conclusion
The Syrian rebel offensive is still only very recent history; as more data becomes available, analyses will illuminate which factors were truly decisive in the campaign. Yet, as FPV technology proliferates, observers are hungry for lessons learned and insights into implications for future conflicts. The Syrian case demonstrates there may still be a window of advantage for forces employing FPV attack drones, as not all militaries have invested in effective countermeasures. Within this window, minimally equipped forces may turn a relatively small investment in FPV drones into an outsized operational effect. The precision mass and relatively low cost per kill afforded by FPV drones make them perfect weapons to decisively alter many conflicts worldwide.
Please consider sharing our work.
You can read the first article in this series here:
FPV Attack Drone Proliferation: Unfreezing Conflict in Syria
The views and opinions expressed on War Quants are those of the authors and do not necessarily reflect the official policy or position of the United States Government, the Department of Defense, or any other agency or organization.


What a great idea for a model. You could apply this to other aspects of the battlefield as well, definitely learned something from this.
Great work, Sean, to quantize warfare and the role/risk associated with sUAS in warfare. It will be interesting to see how these numbers shift as we grow more intricate kill webs with multiple agents / sensors. Keep writing!